MARCH FOR THE MISSING
July 2021 Entry:
STATE OF INDIANA MISSING PERSON STATS
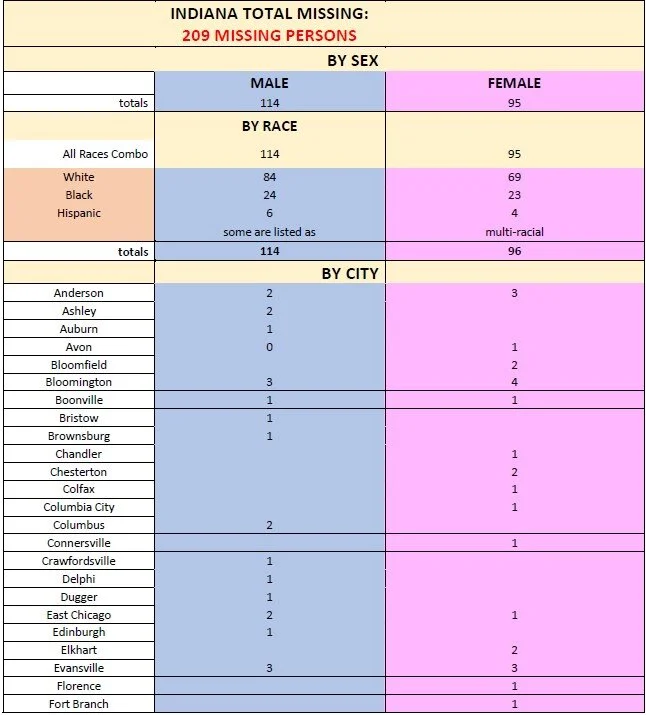
In the state of Indiana, according to NAMUS, there are currently 209 active missing person cases. I imagine this number may likely be higher assuming all missing person cases may not be entered into the NAMUS database. It’s also been my experience that not all missing person cases submitted to NAMUS are approved for entry. There are varying reasons for this.
The information below is based on the state of Indiana, broken down by sex, race, geographical location, decade and age. Dates span from the 1930’s to June 27, 2021.
A separate study is being done on the unidentified, as well as unsolved homicides.
STATS PER SEX
Out of the current 209 active cases:
114 are male
95 are female
STATS PER RACE
84 of those missing males are Caucasian, 24 are Black, and 6 are Hispanic
69 of those missing females are Caucasian, 23 are Black and 4 are Hispanic
**The racial make-up of missing cases numbers vary due to multi-racial boxes checked. The highest racial make-up of missing persons is Caucasian, followed by Black and then Hispanic. There were no listed missing person cases for Asian or Native American. These percentages can also be affected by how many cases of any given race are entered into the NAMUS system.
GEOGRAPHICAL AREAS
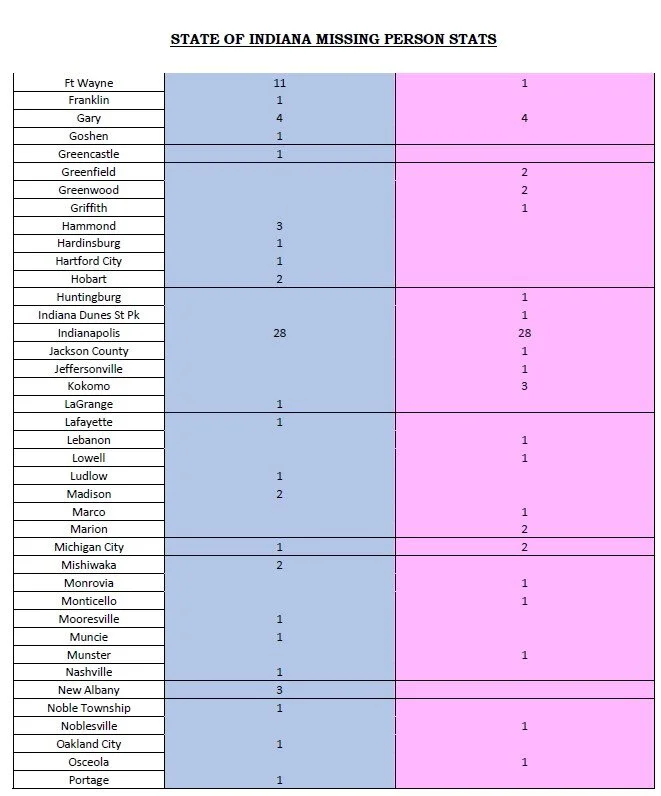
Out of the approximately 81 cities listed, the highest cases differ slightly depending on sex, and include:
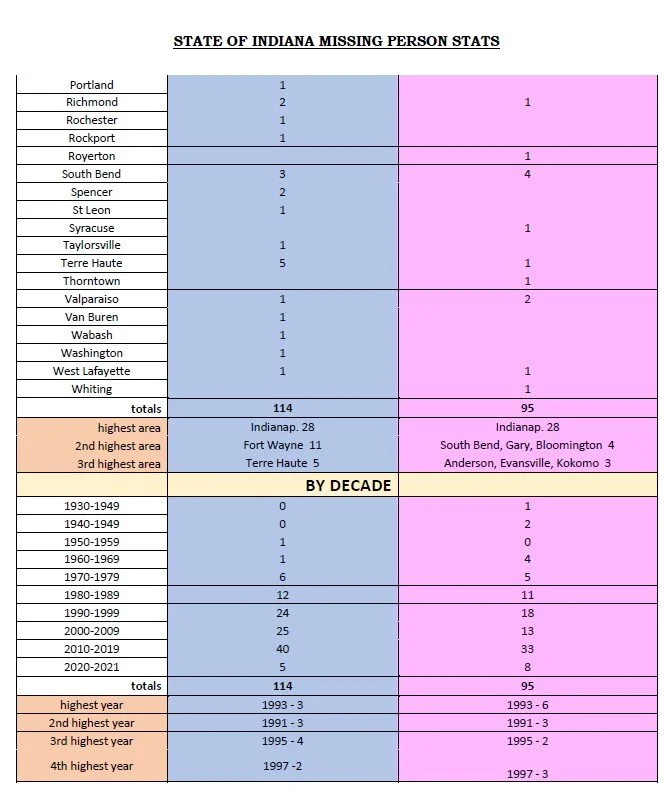
Indianapolis, Fort Wayne and Terre Haute
TIMELINE -DECADES OF CASES
1930’s & 1940’s
Indiana missing person cases listed in the database stem back to the 1930’s.
One of the oldest cases being from 1931.
There were two additional cases in the 1940’s, both decades involved missing females.
The 1950’s and 1960’s:
Added a few more cases, increasing the cases to a total of nine cases listed across four decades (1930, 1940, 1950, 1960)
Again, accuracy depends on the number of cases actually entered into the database, some of those older cases may not be entered.
In the 1970’s:
Cases increased slightly with a total of ten missing person entries from 1970 to 1979.
The eleven cases included six missing males and five missing females.
The 1980’s:
Missing person entries nearly doubled from the 1970’s with 12 missing males and 11 missing females.
A total of 33 missing person cases are listed from 1970-1989.
*Note, it is possible in the older decades that people were less likely to be reported missing. With modern technology it has been easier to keep contact with people, noting when regular daily contact ceases. Nowadays, with so many apps and devices, the ability to maintain contact by the hour is possible. This allows families to immediately identify when unusual incidents occur possibly affecting the frequency and urgency of reporting a person missing.
The 1990’s:
Saw another big increase in missing person cases according to the database.
The number of missing person cases doubled again from those in the 1980’s.
A total of 24 missing males and 18 missing females are listed from 1990 to 1999, doubling the 12 missing males and 11 missing females from the 1980s.
From 2000-2009:
The missing person numbers remained close to the previous decade.
This decade lists 25 missing males and 13 missing females.
The number of missing males increased by one, while the number of missing females seemed to have dropped.
From 2010 to 2019:
Another decade where missing person cases appear to have doubled from the decade prior.
40 males and 33 females were reported missing, with the female cases more than doubling.
Currently, at the time of this study, from January 1 2020 to June 27th, 2021:
There are a total of 13 missing persons listed in the database
8 of those cases were added in the year 2020
5 have been added in 2021
A total of 5 missing males and 8 missing females have been entered into the database.
AGE OF POTENTIAL RISK
Again, the results depend on cases entered. You will notice the age range vs risk varies a little between the male and female missing person cases. Age ranges were broken down into various age brackets some ages have more vulnerabilities and risk factors, for example, a 20 year old may assumed to be a higher risk than a 25 year old and we wanted to see if there was a difference in those age brackets.
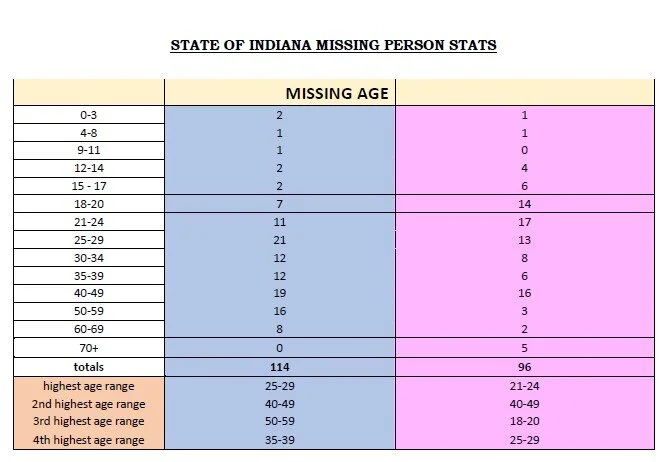
According to the study, the age ranges below appear to be the highest risk per sex:
The highest risk age range for MALES is:
Age 25-29 with 21 missing
Age 40 – 49 with 19 missing
Age 50 – 59 with 16 missing
Age 30-34 with 12 missing
Age 30-39 with 12 missing
If you combine the 30-39 age bracket, this age would come in at higher number of 24. There didn’t appear to be a difference in risk factor between a 30 y/o male and a 39 y/o male
Surprisingly, for males in the 18-20 range, the numbers were only at 7
The highest risk age range for FEMALES is:
Age 21-24 with 17 missing
Age 40 – 49 with 16 missing
Age 18 -20 with 14 missing
Age 25-29 with 13 missing
Age 30-34 with 8 missing
Age 35 – 39 with 6 missing
If you combine the 30-39 age bracket, this age would come in at 13 missing, a bit lower than the male counterparts. There didn’t appear to be a difference in risk factor between a 30 y/o female and a 39 y/o female
*see chart below